Academic Performance
At KS4 we are consistently above the National Average for student progress, with strong attainment, particularly for the percentage of students achieving English and Mathematics GCSE.
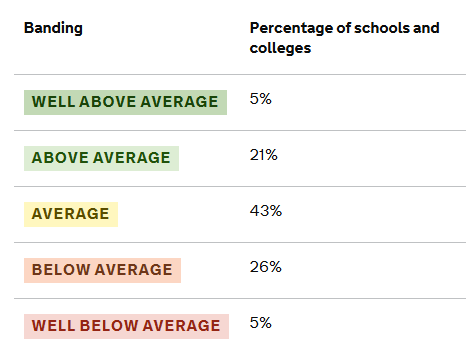
With a KS5 A Level ALPs score above 3, for the last seven years, our Post 16 provision remains outstanding. In 2024, our Progress Score placed us in the top 5% of all schools and colleges in England.
We continue to impress with our excellent BTEC Level 3 National results, with over 85% of students securing a Distinction* to Merit grade.
Behind the figures, every success is founded on hard work and the cooperation between parents, students and teachers.
Notable successes include:
Year 11 Academic excellence

| Preyansh Thaker | |
| English Language [8] | Physics [9] |
| English Literature [9] | Computer Science [8] |
| Mathematics [8] | History [8] |
| Biology [9] | French [7] |
| Chemistry [9 | |

| Ishneet Kaur Sachdeva | |
| English Language [9] | Physics [7] |
| English Literature [9] | Business [9] |
| Mathematics [7] | Geography [8] |
| Biology [8] | French [8] |
| Chemistry [8] | |

| Prem Ghatora | |
| English Language [8] | Physics [8] |
| English Literature [7] | Sociology[9] |
| Mathematics [8] | History [9] |
| Biology [8] | French [8] |
| Chemistry [8] | |

| Harjap Bhatia | |
| English Language [6] | Combined Science [9-9] |
| English Literature [8] | French [8] |
| Mathematics [8] | Computer Science [7] |
| History [8] | Business[7] |

| Louis De Vera | |
| English Language [9] | Physics [8] |
| English Literature [8] | Geography[9] |
| Mathematics [8] | Business [8] |
| Biology [8] | French [7] |
| Chemistry [7] | |

| Navvya Makwana | |
| English Language [9] | Physics [9] |
| English Literature [9] | Business [9] |
| Mathematics [9] | History [9] |
| Biology [9] | French [9] |
| Chemistry [9] | |

| Simranjeet Kaur | |
| English Language [6] | Combined Science [9-9] |
| English Literature [8] | Business [9] |
| Mathematics [9] | Sociology [9] |
| History [9] | French [8] |
| Angelina Tihhomirova | |
| English Language [9] | Art Craft and Design [9] |
| English Literature [9] | History [9] |
| Mathematics [7] | Russian [9] |
| Combined Science [8-7] | Business [7] |
| French [7] | |

| Solanus Viegas | |
| English Language [8] | Physics [9] |
| English Literature [7] | Business [9] |
| Mathematics [8] | Geography [8] |
| Biology [9] | French [7] |
| Chemistry [9] | |

| Biansha Kapoor | |
| English Language [9] | Mathematics [8] |
| English Literature [9] | French [8] |
| Biology [8] | History [9] |
| Chemistry [8] | Graphic Design [7] |
| Physics [9] |
Year 13 Academic excellence
 Alisha Rizwan
A-Level Psychology: A*
A-Level English: A
A-Level Mathematics: A
 Diya Harrish
A-Level Chemistry: A*
A-Level Mathematics: A*
A-Level Physics: A*
 Qais Remtulla
A-Level Economics: A*
A-Level Mathematics: A*
A-Level Physics: A*
 Rianna Ludhra
A-Level Biology: A
A-Level Economics: A*
A-Level Mathematics: A
 Aman Josan
BTEC Business: D*D
BTEC Information Technology: D
 Callon Souza
T Levels Management and Admin: DDD
 Dilneet Kaur
BTEC Business: D*D
BTEC Information Technology: D
 Smriti Bisht
A-Level Economics: A
BTEC Applied Science: D*D*
 Chloe Achkar
A-Level Economics: A*
A-Level English: A*
A-Level Psychology: A*
 Priyal Bharatkumar
A-Level Economics: A*
A-Level Mathematics: A*
A-Level Physics: A
 Jaspreet Sarna
A-Level Economics: A*
A-Level Geography: A
A-Level Mathametics: A
 Moaiad Adam
A-Level Biology: A
A-Level Chemistry: A
A-Level Mathematics: A
KEY STAGE 4 RESULTS
Progress 8
|
Elements |
2023 | 2024 | 2025 |
|
Whole School |
+0.46 | +0.29 | NA* |
* There is no P8 Data for 2025 or 2026 due to the COVID-19 19 Pandemic during the students' KS2 SATs.
What does Progress 8 measure?
Progress 8 calculates how much progress students make between their results in Year 6 (when students are aged 10 or 11) and their results in Year 11 (when students are 15 or 16).
Progress 8 compares students’ Year 11 exam results with those of other students with similar Year 6 results.
Students’ Progress 8 scores are only worked out so that the school’s overall Progress 8 score can be worked out.
A school’s Progress 8 score is an average of all students’ individual scores. It shows whether, as a group, students in the school made above or below average progress compared to similar students in other schools.
Which subjects are included?
Progress 8 is designed to offer a broad and balanced curriculum, with a focus on academic subjects. Students will have their achievement measured across eight subjects. These will include:
- Mathematics and English
- Three English Baccalaureate (EBacc) qualifications (which include Sciences, History, Geography and Languages)
- Three other approved qualifications (from the ‘open group’)
The image at the bottom of this page shows how these different groups of subjects fit together for Progress 8.
If a student sits more than eight subjects, the highest results for the qualifications in each group will be used.
If a student has not taken eight qualifications, they will get a lower Progress 8 score.
Please note that Progress data for 2020 and 2021 has not been published by the DfE.
 |
 |
 |
Attainment 8
|
Indicator |
Results |
National |
||
| 2023 | 2024 | 2025 |
2025 |
|
|
Whole School |
48.1 | 48.6 | 49.5 |
45.9 |
Schools get a score based on how well students have performed in up to 8 qualifications, which include English, Mathematics, 3 English Baccalaureate qualifications including the Sciences, Computer Science, History, Geography and Languages, and 3 other additional approved qualifications. Mathematics and English are also double weighted compared to other subjects.
To calculate the Attainment 8 score, each student's qualifying grades are converted to points and added up, with Mathematics and English double-weighted. Since 2017, reformed GCSEs have been graded on a 1-9 scale.
|
|
 |

Proportion of students achieving a Grade 4 or above in English and Mathematics
| 2023 | 2024 | 2025 | National | |
|
% of students achieving 4+ in GCSE Mathematics and English |
72 | 73 | 75 | 65 |
Until 2017, achieving GCSE grades A*- C in English and Mathematics was widely recognised as the minimum required to commence Post-16 study such as A Levels or vocational qualifications. Schools have also been ranked in performance tables by this ‘Basics’ measure.
From 2017, Grade 4 in the reformed GCSE examinations has been regarded as a 'standard pass' and represents the minimum entry requirement for further education.
Proportion of students achieving a Grade 5 or above in English and Mathematics
| 2023 |
2024 |
2025 | National | |
|
% of students achieving 5+ in GCSE Mathematics and English |
52 |
51 |
52 | 45 |
Proportion of students achieving the English Baccalaureate [EBacc]
| 2023 | 2024 | 2025 | National | |
|
% Entering EBacc |
74 |
82 |
80 | 40 |
|
% English Baccalaureate at grade 5 |
4.54 |
4.54 |
4.73 | 4.08 |
The English Baccalaureate [EBacc] is a school performance measure used by the Department for Education. It measures the proportion of students in Year 11 who gain GCSE grades 5 -9 in the following subjects:
English
Mathematics
Two Sciences [Two from GCSE Computer Science, Biology, Chemistry or Physics, or GCSE Combined Science]
A language [modern languages, ancient languages such as Latin or community languages]
History or Geography
Proportion of students staying in education or going into employment after KS4
|
|
2022 |
2023 | 2024 | National |
|
% of students continuing in education or training |
95 |
94 | TBC | 91 |
This measures the number of students who either stayed in education or went into employment after Year 11.
KEY STAGE 5 RESULTS
A Level – Progress score
|
Indicator |
Results |
National |
||
| 2023 | 2024 |
2025 |
2024 |
|
|
Average Grade |
B | B- |
B- |
B- |
| ALPS | 2 | 3 | 2 | 5 |
| Progress Score | NA | 0.41 [~Top 5%] | TBC | -0.03 |
These figures are based on students who entered at least one A Level or AS Level. A Levels are available in a wide range of subjects, including English, Mathematics, the Sciences, Languages and Humanities.
ALPS [A-Level Progress Score] is an alternative measurement that allows schools to analysis KS5 progression for students from different KS4 starting points and is benchmarked against national data sets. A score of 3 places schools approximately in the top 25% of schools for progress. A score of 2 places schools approximately in the top 10% of schools for progress.
The Progress Score provided by the DFE and equates to a national ranking of all Schools and Colleges in England.
Applied General Qualifications – average grade achieved
|
Indicator |
Results |
National |
||
| 2023 | 2024 |
2025 |
2024 |
|
|
Average Grade |
D- | M+ |
M+ |
M+ |
| ALPs | 4 | 6 | 3 | 5 |
Applied general are qualifications that provide broad study of a vocational area. They are designed to lead to higher education, and they include areas such as performing arts, business and health and social care. These figures are based on students who were entered for at least one applied general qualifications. Please note that Value Added data for 2020, 2021 and 2022 has not been published.
Progress in English and Mathematics
|
Indicator |
Results |
National |
||
| 2023 | 2024 |
2025 |
2025 |
|
|
English |
NA | NA |
1.4 |
TBC |
| Maths | NA | NA | 0.0 | TBC |
National figures have not been provided and will return in 2025.
These scores show how much progress students at our School made in GCSE English and Mathematics retakes, between the end of Key Stage 4 and the end of the 16 to 18 phase of education. A positive score means that, on average, students got higher grades at 16 to 18 than at Key Stage 4. A negative score means that, on average, students got lower grades than at Key Stage 4. Students are included in these measures if they did not achieve a grade 4 or higher in their GCSE or equivalent by the end of Key Stage 4 in that subject.
Retention
|
Indicator |
Results |
National |
|||
| 2021 | 2022 | 2023 |
2024 |
2024 |
|
|
% of students staying in education or employment |
95 | 95 | 96 |
TBC |
94 |
As the participation age has been increased to 18, it is increasingly important that all young people are given suitable education and training opportunities that they see through to completion. The retention measure shows the percentage of students who get to the end of the Post-16 programme of study that they enroled on.
Proportion of students staying in education or going into employment after KS5
|
Indicator |
2020 |
2021 |
2022 |
National |
|
% of students staying in education or going into employment after KS5 |
87 |
88 |
86 |
80 |
This measures the number of students who either stayed in education or went into employment after Year 13. The figures include undisclosed destinations.